EBITDA Multiples for Canadian Small Businesses
Current transaction data shows private Canadian businesses trading well below headline multiples.

An EBITDA multiple tells you how many years of current earnings a buyer is paying for. Divide enterprise value by EBITDA and that's the number. It drives most conversations about what a Canadian small business is worth, and most of those conversations start in the wrong place: with a multiple pulled from a headline instead of a multiple that matches the business actually being sold.
The metric caught on because it strips out noise. Two companies with identical operations can carry wildly different debt loads, tax positions, and depreciation schedules, and EBITDA normalizes across all three so buyers can compare businesses on operating performance alone. It stands in reasonably well for cash flow before financing decisions enter the picture, and it lets an acquirer sitting across the table from three sellers rank them on something close to apples to apples.
The framing breaks down fast for the businesses most Canadian owners actually run, and this is where sellers get burned before they even reach the table. EBITDA leaves a market-rate management salary sitting in the cost base, on the assumption that whoever buys the company hires someone to run it. Seller's discretionary earnings, or SDE, does the opposite: it adds the owner's salary back in, because the model assumes a buyer who steps directly into the operator's chair. Most Canadian small businesses under a modest revenue threshold get valued on SDE, not EBITDA, and the mistake is treating that as a technicality rather than the whole ballgame. Applying an EBITDA multiple to an owner-operated business shrinks the earnings base itself, since a full salary never gets added back, and the resulting number can land well below what SDE framing produces on the identical set of books. The reverse error happens too: a seller or broker applies a multiple meant for a business that already carries a market-rate manager to what is really an SDE-class business, inflating the sticker price before a single buyer even looks at the file. Buyers who know the difference push back on this immediately, and they're right to.
A second trap catches people who did their homework, just the wrong homework. Public-market multiples are not a reference point for private transactions, full stop. A synthesis of data from GF Data, Bain, McKinsey, and Lincoln International found public multiples running 30 to 50% above comparable private multiples, a gap driven by liquidity, disclosure requirements, and scale, not by some universal truth about what a business is worth. Anyone anchoring on a number pulled from a trade headline or a public-market table needs to trace that number to its source first: which universe of deals it describes, which earnings metric produces it, what size band it belongs to. If that step is skipped, every conclusion built on top of it is wrong before the analysis even starts.
What the transaction data shows for private Canadian businesses in 2025-2026
When the headline multiples are stripped away, the transaction data tells a more modest story than the trade press suggests. The DealStats Value Index, tracking private company transactions across its full history, is a median of 4.1x EBITDA. The most recent read, Q4 2025, is 3.5x, down from 3.7x in the first quarter of the same year. The Q4 2025 read of 3.5x, down from 3.7x in the first quarter of the same year, is a real and measurable softening in deal pricing over three quarters, and anyone quoting the 4.1x figure as current is quoting a number that's already stale. It is, however, a real and measurable softening in deal pricing over three quarters, and anyone quoting the 4.1x figure as current is quoting a number that's already stale.
In the Main Street segment, the true small business tier, the metric itself changes to SDE for the reasons already covered. BizBuySell's marketplace data puts the 2025 average SDE multiple at 2.61x, up about 1% from 2024 but still sitting well below prior cycle peaks. The Q4 2025 cross-sector average came in slightly lower still, at 2.57x.
In the lower middle market, the Q3 2025 median is 5.3x EBITDA per the IBBA's Market Pulse survey. That's a wide gap from the Main Street number, and it isn't random. The next section explains why size does that to a multiple. For the Canadian lower middle market specifically, Windsor Drake's analysis puts private companies at 4.0x to 8.0x adjusted EBITDA.
The 8x, 9x, 10x figures showing up in trade press coverage are almost always large strategic acquisitions, and a good chunk of them carry undisclosed earnouts that shave 1 to 2 turns off the effective multiple once the deal closes. They are not realistic anchors for a founder-owned business in a regional Canadian market. Treating them as one is the single most common valuation mistake a seller makes before ever talking to a broker, and it's an avoidable one. Even the medians above hide something important: within any one sector, the distance between a top-quartile business and a bottom-quartile business often spans several full turns of EBITDA. A median is a midpoint on a distribution, nothing more. What explains that spread is the subject of the next four sections.
Industry sector sets the floor and ceiling before anything else
Why does one industry trade at 3x while another trades at several times that? Not arbitrarily. The gap reflects structural differences in how a business makes money: whether revenue recurs or gets rebuilt project by project, how much margin survives after costs, how much capital the business eats just to stay open, how exposed it is to the business cycle.
The two ends of the spectrum make the logic obvious. Accommodation and food service businesses trade around 2.5x on the DealStats all-time measure. Revenue comes in transaction by transaction, margins run thin, the capital tied up in kitchens and buildings is heavy, and the whole sector rides the economic cycle up and down with no protection. Enterprise software is at the opposite pole, trading in an 8x to 15x range, with high-growth SaaS reaching as high as 25x at the extreme, with high-growth SaaS reaching as high as 25x at the extreme. Recurring subscription revenue, gross margins that dwarf almost every other industry, a cost structure that scales without adding headcount proportionally: buyers pay for all of that, and they pay well for it.
For the sectors that make up most of the Canadian small business economy, the ranges compress but the logic holds. Home services split by trade: HVAC runs 4x to 8x EBITDA, plumbing runs in a similar range, and in both cases maintenance contracts and commercial client mix push a business toward the top of its range (data from CT Acquisitions and Breakwater M&A). Manufacturing is at 5x to 7x broadly, with higher-complexity, differentiated work commanding the high end while general contract manufacturing settles at the bottom. Healthcare services span 5x to 9x, and multi-site practices with contracted payer relationships sit at the top of that band. Professional services firms in accounting, law, consulting, and engineering trade at 4x to 7x, with key-person risk acting as the single biggest drag on where any one firm lands. Physical therapy clinics run 4x to 7x per Breakwater's data. Construction and trades sit lower still, at 3x to 5x, held down by project-based revenue, heavy owner dependency, and cyclicality baked into the business model.
None of this tells an owner where their own business lands inside its range. It only tells them which range applies. That's a function of size and operations, covered next. Even within a single province, the spread stays wide. BC data compiled by BizBuy.ca shows restaurants trading at 1.5x to 3.0x SDE, HVAC at 2.5x to 4.5x, dental practices at 3.0x to 5.5x EBITDA. Same province, same regulatory environment, and still that much daylight between the low end and the high end. Sector sets the pond. It doesn't set your spot in it.
The size of your EBITDA matters almost as much as your industry
A pattern holds across nearly every sector and every point in the deal cycle: bigger businesses get paid more for each dollar of earnings than smaller ones do. Not slightly more, either. Most owners underestimate just how structural that premium is, and consistently so, until they see the size bands laid out side by side.
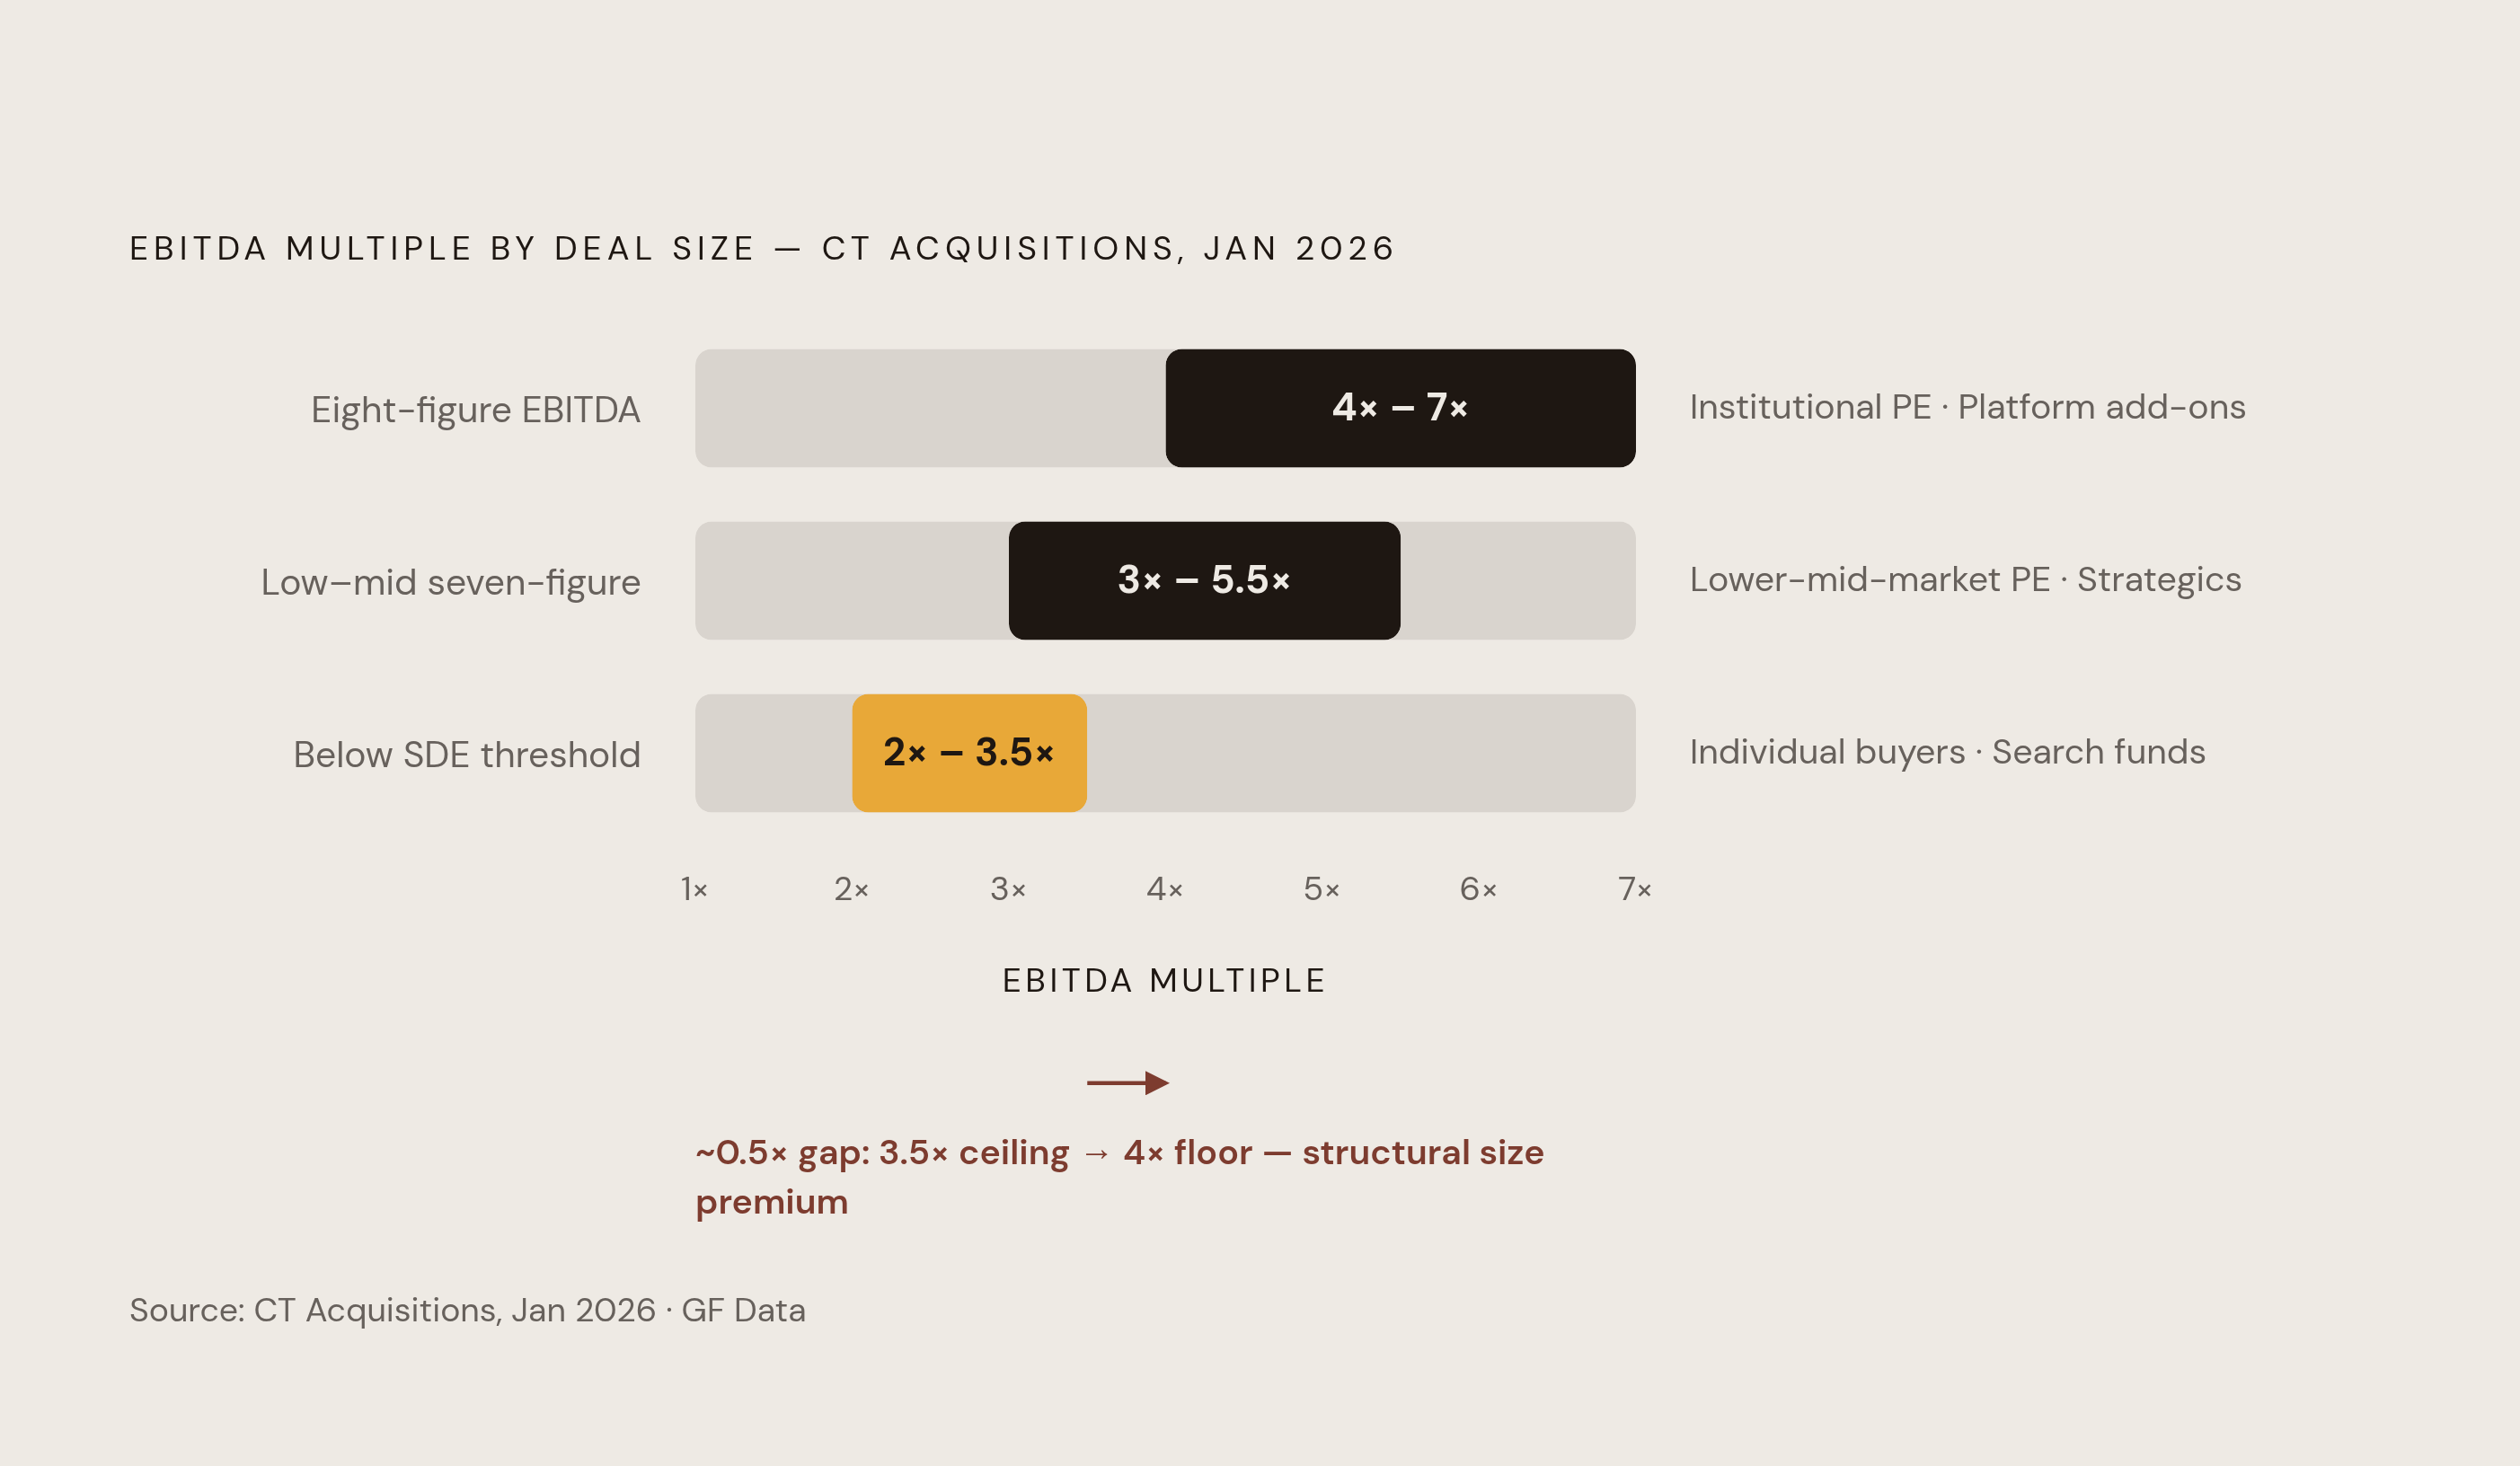
CT Acquisitions' January 2026 breakdown lays out those bands cleanly. Businesses under a modest SDE threshold trade at 2x to 3.5x, a tier dominated by individual buyers and search funds working with SBA-style financing, where the buyer pool runs shallow and the risk of the business collapsing the moment the owner walks out the door is at its highest. Lower middle market private equity and strategic acquirers appear and start bidding against each other in the low-to-mid seven-figure EBITDA range, pushing multiples up to 3x to 5.5x. In eight-figure EBITDA territory, the range runs 4x to 7x, with institutional PE, platform add-on buyers, and a much wider set of financing options all competing for the same asset.
GF Data's deal analysis, tracking transactions under a set enterprise value ceiling, found the gap between the smallest deals and the next tier up running close to a full turn of EBITDA, and that gap held steady across the periods studied. The same pattern shows up consistently across deal cycles: larger platform transactions attract stronger pricing, while smaller deals and add-ons tend to hold flat or lag behind. The premium for size isn't narrowing. If anything, it's holding firm while everything around it moves.
Three mechanisms drive that premium, and they compound rather than sit side by side. A bigger business draws a deeper pool of buyers. This creates more competitive tension in a process and fewer sole-source negotiations where the seller has no leverage. Bigger businesses also access cheaper financing, since institutional lenders offer better terms once deal size clears their minimum thresholds. And size tends to correlate with more professionalized operations, which lowers the risk that the business falls apart during the transition period after closing. Buyers pay for all three, separately and together, and that stacking effect is why the jump between size bands looks so much larger than any single factor would predict on its own.
For an owner sitting just under the next size threshold, crossing that line can move the applicable multiple range more than any single operational fix inside the current tier. Growing EBITDA past that next threshold, over three or four years of runway before a sale, is a lever with more force behind it than almost anything else on the table.
The operational factors that push any business above or below its sector median
Size and sector set the range. What determines where inside that range a specific business lands comes down to a short list of operational factors, and Praxis Rock's 2026 analysis underscores the stakes: a business generating identical EBITDA can vary substantially in enterprise value depending on where it sits on each one.
Owner dependency does more damage to a multiple than any other single factor in the lower middle market, and it isn't close. Across the lower middle market, practitioners broadly observe that a business unable to run without the founder present can see the multiple drop by a full 1 to 2 turns. The gap between an owner-dependent business and an otherwise comparable, owner-independent one in the same industry can span several full turns of EBITDA. That gap swallows almost every other factor on this list combined, and it's the one most owners could actually fix if they started early enough. An owner who fixes nothing else but this has still done the most valuable work available to them. Closing it takes structural work, not a memo, including documented processes, a management layer capable of running things day to day, and proof, sustained over time, that revenue holds up when the founder isn't the one answering the phone.
Recurring revenue ranks close behind as a key value driver, consistently commanding a meaningful premium over project-based revenue across sectors. This isn't a theoretical preference. Carson Bomar, a broker quoted in BizBuySell's report, pointed to a "significant increase in private equity activity, particularly in service-based and recurring revenue businesses." Buyers are paying up for contracted, repeatable revenue right now, not someday down the road. A business with multi-year service contracts out-earns a flat, project-based competitor in the identical sector, even when both post the same trailing-twelve-month EBITDA today.
Customer concentration works as a direct tax on the multiple once it crosses certain thresholds. Practitioners broadly observe that once a single customer represents an outsized share of revenue, the multiple takes a meaningful discount. When concentration in a small handful of customers becomes severe, that discount can widen further still. The logic is simple: a buyer is pricing in the real chance that the biggest customer walks the moment ownership changes hands, and the discount functions as the insurance premium against that outcome.
Growth trajectory gets priced forward, not backward. Transaction data consistently shows that a business with strong organic growth earns offers meaningfully above a flat or shrinking peer, though that growth has to be organic and durable enough to survive diligence, not a one-time contract that inflated a single year's numbers. Declining revenue disqualifies a business outright for entire categories of buyer, no matter how healthy current EBITDA looks on paper.
EBITDA margin relative to peers matters too: it affects how a buyer prices the business, since it signals pricing power and operating discipline rather than just profitability. Businesses posting margins above 25% typically command a premium over same-industry peers running thinner margins. Margin signals pricing power and operating discipline a buyer can reasonably expect to persist after closing, and that is what they're paying to inherit.
Then there's the unglamorous stuff: financial hygiene. Clean books, properly documented add-backs, and reviewed or audited statements support pricing at the top of a sector's range. Messy books do the opposite, and worse, hand a buyer grounds to re-trade the deal after diligence turns up something they weren't expecting. Iconic's analysis lays out the math: an extra $200,000 of defensible, well-documented adjusted EBITDA at a 4.5x multiple is $900,000 of added enterprise value. Normalizing the earnings base is value creation, dollar for dollar, and treating it as an afterthought during diligence prep leaves real money sitting on the table.
One factor gets overlooked more than it should: who's actually bidding. A PE platform acquisition commands a higher multiple than an add-on purchase in the same sector. A strategic buyer pays for synergies a financial buyer simply cannot justify on its own model. Search funds and individual buyers, constrained by the capital they can raise, typically pay under market. The businesses that draw the widest, most competitive buyer pool tend to land closer to the top of their sector range. The sale process itself shapes the outcome as much as anything sitting on the balance sheet.
The Canadian market context shapes what these benchmarks mean in practice
Provincial context isn't a footnote. It changes the arithmetic. An analysis from patelsanket.ca finds that in Alberta, small businesses valued on SDE trade at 1.5x to 3.5x, while mid-size Alberta businesses valued on EBITDA trade at 3x to 6x. Even the choice of which metric applies turns out to be a local market call, not something fixed by a textbook formula.
Windsor Drake's figures show the Canadian lower middle market trades at 4.0x to 8.0x adjusted EBITDA, broadly consistent with what shows up south of the border. Consistency in the range doesn't guarantee consistency in outcome, though, because the buyer pool behind those multiples runs thinner in most of Canada outside Toronto and Vancouver. A business that never gets marketed to buyers south of the border, or never gets positioned for the specific criteria active private equity groups are screening for in its sector, can transact below benchmark for reasons that have nothing to do with the business's underlying quality. The competition for it simply never had the chance to form.
Financing availability plays into this too. SBA lending doesn't exist in Canada, but the underlying dynamic still applies just as clearly: tighter financing produces thinner competitive tension, which compresses multiples. That lines up with why the Q4 2025 DealStats figure of 3.5x sits below the 4.1x all-time median. When credit gets harder to access at the small end of the market, fewer buyers can compete for the same business, and pricing softens accordingly.
Founder dependency, covered above as a general operational factor, comes closer to a defining feature of the Canadian small business landscape than a generic risk factor. Most businesses across a wide EBITDA range in this country are owner-operated, which makes founder dependency the most common discount sitting on the table for Canadian sellers. It's also the most fixable one, provided there's enough runway before the sale to fix it.
Time is the variable an owner controls most directly, and it decides how much of that gap actually closes before a sale happens. A business with three or more years of runway before a planned exit has room to work through owner dependency, build out recurring revenue, diversify a concentrated customer base, and clean up the books, tackled one at a time rather than all at once under deadline pressure. Seen that way, a benchmark multiple functions less like a number to react to and more like a checklist.
Turning a benchmark into a valuation strategy before going to market
None of the figures above should be read as a verdict. A 4x sector median doesn't say what a specific business is worth. It says what businesses at that sector's midpoint, carrying average owner dependency, average customer concentration, and average revenue quality, have recently sold for. This entire piece has been an exercise in pulling that median apart into its actual components: which earnings metric applies, what size band the business sits in, which operational levers, owner dependency, recurring revenue, customer concentration, growth, margin, financial hygiene, and buyer pool, are pulling the real number up or down from that midpoint.
That reframing changes what preparation actually looks like. Instead of asking what the business is worth today, on paper, the sharper question is which one or two factors, addressed over the next 24 to 36 months, would move the business from the bottom of its sector range toward the top. For an owner-dependent trades business at 3x, building out a second-in-command and documenting client relationships is likely worth more, in dollar terms, than any amount of top-line growth achieved while the founder stays the single point of failure. For a professional services firm at 4x, converting project work into retainer contracts probably does more for the eventual sale price than adding another partner ever will.
The benchmark, in the end, functions as a starting point for a conversation, not an answer in itself. Owners who treat it that way, who use it to isolate which specific lever applies to their specific business, tend to close the gap between where their company sits today and where it could sit at the point of sale. Owners who take the sector median at face value, or worse, anchor to a public-market or trade-press headline that was never describing their kind of business in the first place, tend to be the ones caught off guard by what the market actually offers when the time finally comes.
Sources
- EBITDA Multiples by Industry: A 2026 Deep Dive · Iconic
- Average EBITDA Multiples by Industry (2026 Data) | Praxis Rock
- EBITDA Multiples by Industry 2026 | Private Market Ranges
- Business Valuation EBITDA Multiple: EBITDA Multiples for Small
- EBITDA Multiples by Industry 2026: Private Deal Data by Size
- ctacquisitions.com