Valuation Adjustments That Increase Your Sale Price
Every $100,000 earnings adjustment multiplies by your sale multiple, not adds.

Most owners walk into a sale process believing their number is fixed: take last year's profit, multiply by whatever figure a peer mentioned at a trade conference, and that's the business's worth. That belief is wrong, and it's wrong in two separate ways that compound against the seller who never questions it. First, the earnings figure itself isn't what shows up on the tax return; it's a normalized, recast number built specifically for the transaction, adjusted line by line before any multiple ever touches it. The multiple applied to that figure moves based on how believable the earnings are, how big the deal is, how predictable the revenue looks, and who's sitting across the table as the buyer.
So two businesses reporting the exact same net profit on their year-end financials can close at wildly different prices, purely as a function of how the seller presented the numbers and positioned the operation. That's a gap large enough to separate a retirement from a disappointment. A retirement or a disappointment can hinge on it.
The market backdrop makes this gap sharper, not softer. PwC's data shows deal value jumped 45% in 2025, crossing $1.6 trillion across more than 10,000 transactions, and Sunbelt Atlanta's 2026 analysis of that activity shows buyers are moving fast, but only toward businesses that show clear, defensible value decipheryourvalue.com. Capital is available. Speed is available. What's scarce is the seller who has actually done the work to make their earnings story hold up under scrutiny.
That gap, between the prepared seller and the unprepared one, has rarely been this wide. Two levers close it: adjustments to the earnings base itself, and adjustments to the multiple applied against it. Both are things an owner can act on before ever listing the business, and both are the subject of everything that follows.
How businesses are valued: the earnings base and the multiple
Strip away the jargon and the formula is simple: Enterprise Value equals earnings times multiple.
Most operating businesses get valued on a multiple of normalized earnings, not revenue and not asset value, unless the company is pre-profit or sits in a recurring-revenue category where margins cluster so tightly that revenue becomes a reasonable proxy. It's built on the assumption that the buyer steps into the owner's chair and does the job personally. That assumption is why it dominates valuation for smaller, owner-operated businesses. Above roughly $2 million in enterprise value, the market shifts to adjusted EBITDA instead, crediting a market-rate manager's salary rather than an owner's discretionary draw, because an institutional buyer is paying for a business that runs without the founder in the building.
The multiple itself scales with deal size, and the bands are worth knowing cold. Businesses under $500,000 in EBITDA, the Main Street segment, trade around 2x to 3.5x ctacquisitions.com.
Why does this ladder matter so much to an owner sitting well below the top rung? Because every dollar of earnings adjustment gets multiplied, not added. At a 6x multiple, a $100,000 add-back doesn't add $100,000 to the sale price. It adds $600,000. That single fact is the entire reason normalization deserves more attention than most sellers give it, and Pepperdine's 2025 Private Capital Markets Report finds that recast or adjusted EBITDA is the dominant valuation method in the lower middle market, appearing in roughly 76% of cases. Before any multiple gets applied, the earnings figure has to be built correctly, and that construction process, normalization, is where the most immediate and controllable value gets created or quietly left on the table. SDE (Seller's Discretionary Earnings) is the income available to one working owner (net profit plus owner salary plus interest, taxes, depreciation, amortization, and expenses that will not continue post-sale), and is used most often for smaller, owner-operated businesses. Businesses with $500k–$1M in EBITDA are valued at 3–4.5x ctacquisitions.com. Businesses with $1M–$3M in EBITDA are valued at 4–6x ctacquisitions.com. Businesses with $3M–$10M in EBITDA are valued at 5–8x ctacquisitions.com. Businesses with $10M–$25M in EBITDA are valued at 6–10x ctacquisitions.com BizBuySell Q1 2026 Insight Report. Businesses with over $25M in EBITDA are valued at 8–12x+ ctacquisitions.com BizBuySell Q1 2026 Insight Report.
EBITDA add-backs and their effect on sale price
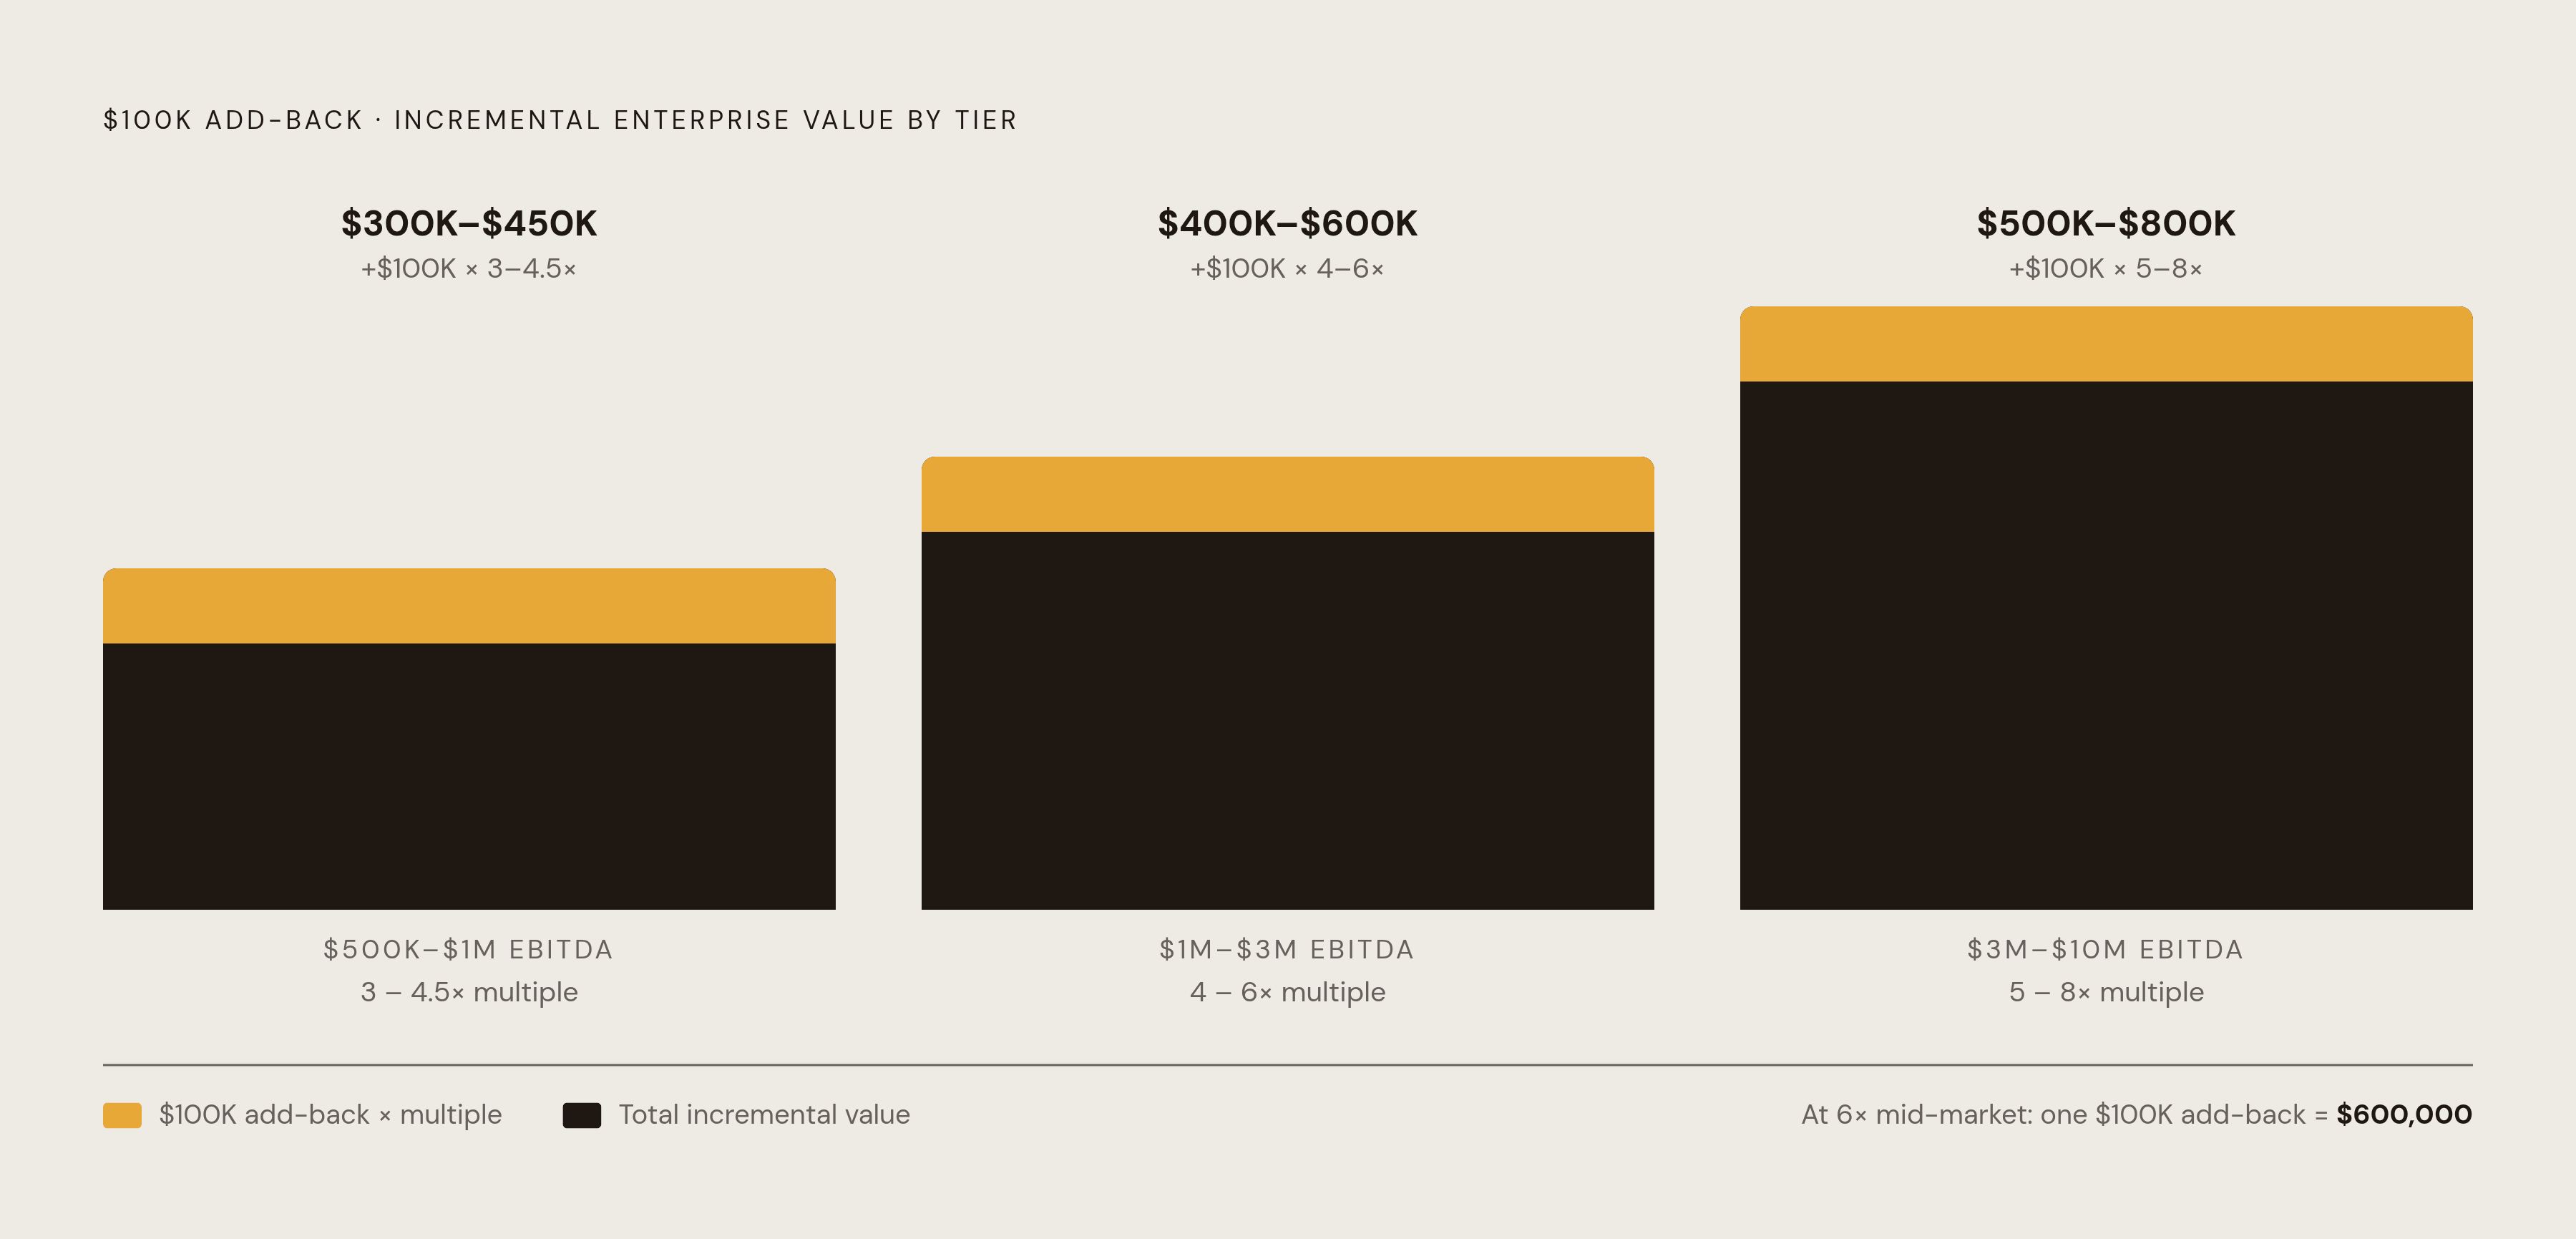
An add-back is any expense sitting inside reported earnings that the buyer simply won't face after closing, whether because it's owner-specific, a one-time event, or priced away from what an arm's-length market rate would actually be. Add it back, and the normalized earnings figure rises. The number the multiple gets applied to rises too. The effect is multiplicative rather than additive. It's multiplicative, and that distinction is why this exercise has to be done carefully rather than casually.
Same business, same operations, same buyer. The only difference is whether someone did the work of identifying what didn't belong in the earnings figure to begin with.
Two categories do the heavy lifting here. Quality-of-earnings adjustments back out items that happened once and won't happen again: a settled lawsuit, proceeds from selling a building, a severance payment tied to a departure that won't repeat. Normalization adjustments are different; they fix recurring items that were simply priced wrong the whole time, like owner compensation set well above what a hired replacement would cost, or rent paid to a related party at a rate that doesn't reflect the market.
Each of these layers gets tested independently during diligence, and the burden of proof sits entirely with the seller on every single line. That deserves a moment of consideration. Nobody is going to accept an add-back because it sounds reasonable. It has to be demonstrated. Which raises the obvious next question: does that mean a seller should claim every add-back they can plausibly argue for? The answer, as the next section lays out, is no, and understanding why is as important as understanding the add-backs themselves. A concrete illustration from the research involves ABC Manufacturing Co., which has $42M in revenue and $4,250,000 in reported EBITDA, where after adjustments, Adjusted EBITDA generates $39.1M of enterprise value at 8.0x versus $34.0M on reported EBITDA, with the adjustment exercise creating $5.1M of incremental purchase price, of which roughly $4.5M flows to the seller after transaction costs Ledgerism.
The six add-back categories buyers consistently accept, and the evidence each one requires
Owner compensation above market rate is usually the largest single add-back, and also the most commonly overstated. The add-back isn't the owner's entire salary; it's only the gap between what the owner actually draws and what a hired replacement, including payroll taxes and benefits, would cost to bring in. Most sellers assert a market rate rather than proving one, which is a mistake, since published federal wage data (Bureau of Labor Statistics figures, for instance) offers a widely used benchmark in diligence, even though it measures employee wages rather than owner compensation specifically and typically gets triangulated against other sources.
Personal expenses run through the company make up the second category, and they tend to be the easiest to document and the easiest to lose credibility over if handled sloppily. Personal vehicle costs, home expenses, personal insurance across home, vehicle, life, and health, personal meals, travel, club memberships, all of it ends the moment the business changes hands, so all of it qualifies, provided each line carries a receipt and a short explanation of why it's personal rather than operational.
Family payroll sits in a grayer zone. Where a family member's role is genuinely non-operational, the entire expense may be addable. Where the family member does real, documented work, only the portion of their pay that exceeds market rate for that role qualifies, and buyers scrutinize job descriptions closely here; a vague or intermittent role invites a challenge that a seller may not win.
One-time and non-recurring expenses form the fourth category: legal disputes, unusual repairs, a relocation, a consulting project that won't repeat. The discipline required is strict. If the same category of expense appears across multiple prior years, calling it "one-time" in the current year won't survive a buyer's prior-year test, and claiming it anyway just damages the credibility of every other add-back on the schedule.
Transaction and M&A professional fees, the accounting, legal, and advisory costs tied directly to the sale process, are legitimate add-backs because they simply will not recur under new ownership.
And related-party rent rounds out the list. Where the seller owns the underlying real estate through a separate entity and charges rent above or below what the market would bear, the adjustment corrects it back to true market rent. Either direction counts: above-market rent inflated the expense line, so the excess gets added back; below-market rent understated the expense line, so the shortfall gets deducted from normalized earnings. This one requires a comparable market rent analysis to hold up, not a guess.
Across all six categories runs the same underlying principle. A seller who arrives with a prepared schedule, each add-back named, categorized, quantified, and backed by receipts or third-party evidence, moves through diligence faster and faces far less retrade risk than a seller who surfaces these items reactively, one at a time, as a buyer's advisor asks pointed questions.
Calibrating add-back claims to avoid backfire
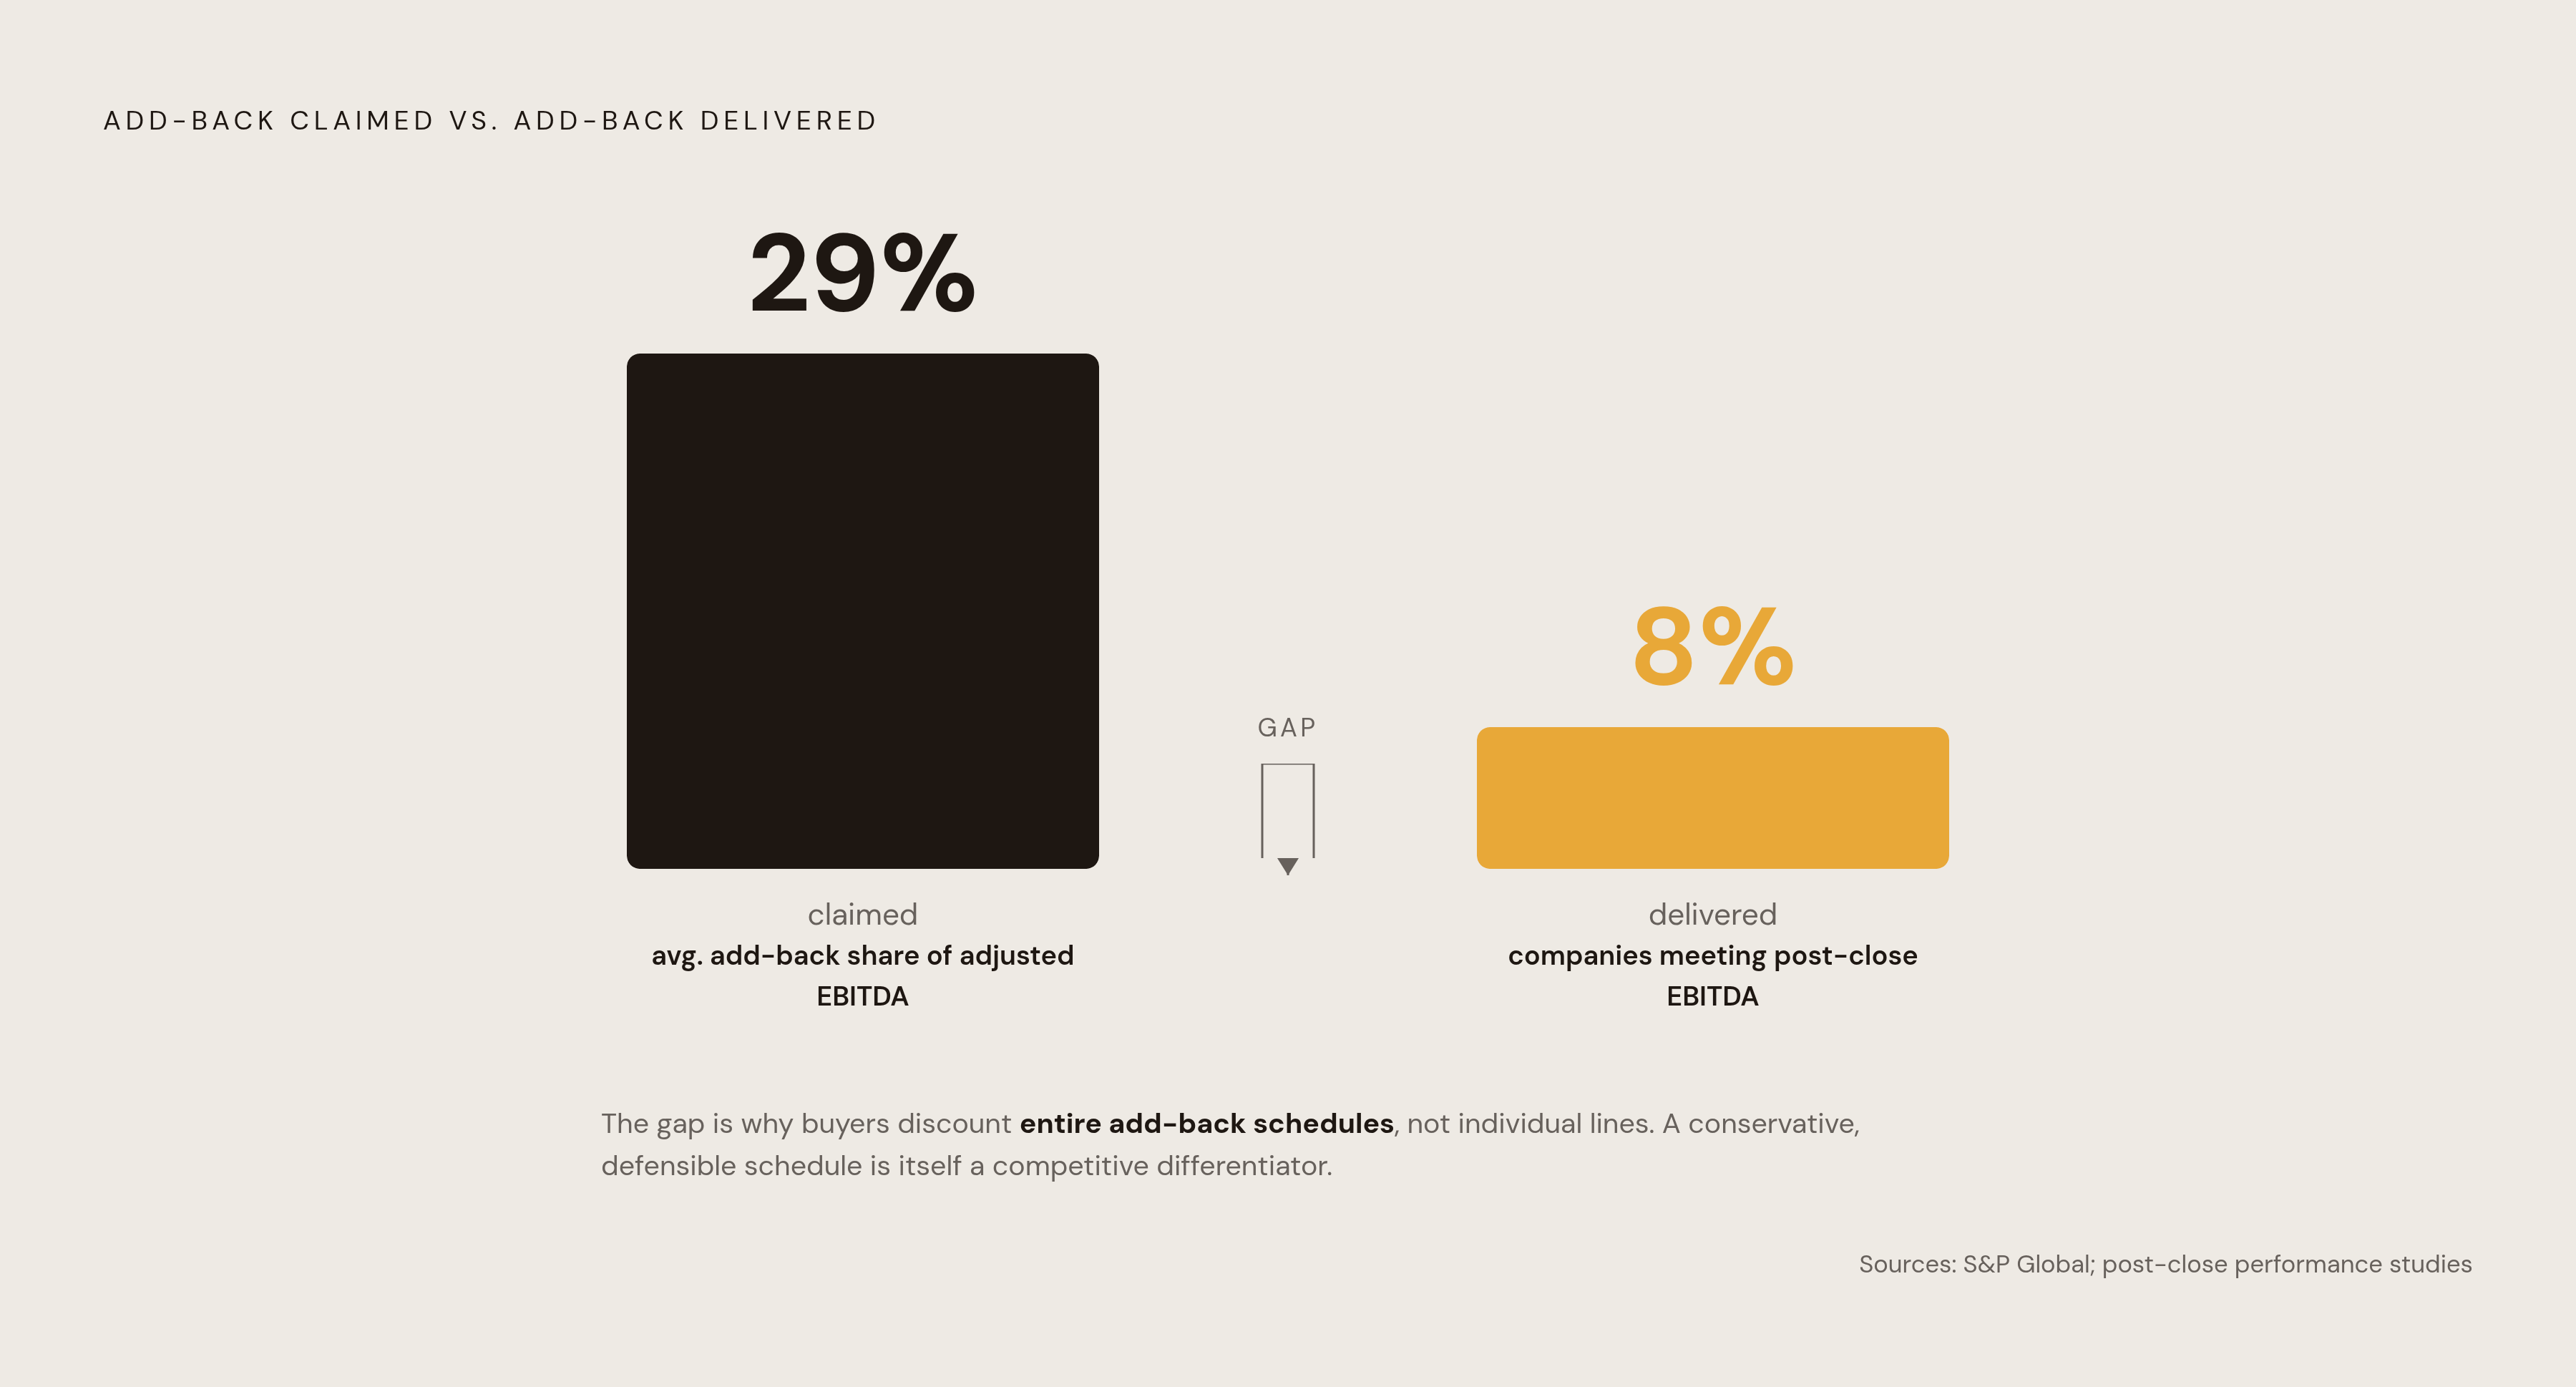
The uncomfortable number is this. S&P Global's research found that add-backs in the average sale process now make up 29% of adjusted EBITDA, and only 8% of companies actually hit post-closing EBITDA that exceeds the projections management presented to buyers before signing. Read that twice. Nearly a third of adjusted earnings is coming from add-backs industry-wide, and the overwhelming majority of sellers are, in effect, overselling what their business actually produces once the deal closes.
That track record has consequences for every seller, not just the ones inflating their numbers. Buyers, and the advisors working for them, now approach add-back schedules with real skepticism baked in from the start, because the base rate of disappointment is so high. Push a marginal claim onto that schedule, and the buyer doesn't just reject the one line. The whole package gets discounted, including the add-backs that were legitimate all along.
That's where retrade risk enters, and it compounds in a way that punishes sellers harder than they expect. If a seller claims a certain adjusted EBITDA figure and the buyer's Quality of Earnings analysis accepts only part of the add-backs, the price doesn't just drop dollar-for-dollar. It re-negotiates downward through the multiple, so the loss on paper is larger than the disallowed add-back itself. A QoE typically strips away a meaningful share of what a seller originally proposed, according to practice-group data from firms including Alvarez & Marsal and BDO, and sellers who never stress-tested their own numbers find this out at the single worst moment in the entire process, mid-negotiation, with a closing date already circled on the calendar.
So what's the actual discipline here? Prioritize the add-backs that are large, clean, and easy to document. Drop the marginal ones, or footnote them honestly rather than folding them into the headline number. Show up with the defensible figure, stated with confidence, instead of the maximum possible figure, stated nervously and walked back the moment a buyer's advisor pushes on it. Confidence built on documentation reads completely differently in a negotiating room than confidence built on hope.
That discipline needs a mechanism to operationalize it before a buyer ever sees the numbers, and that mechanism has a name: the sell-side Quality of Earnings report.
How a sell-side Quality of Earnings report changes the negotiation dynamic
A QoE gets confused with an audit constantly, and the distinction affects how the deal price gets defended in negotiations. An audit confirms that financials follow accounting rules; it says nothing about whether the profits are real or repeatable. A QoE asks the harder question directly: are these earnings actually going to continue, are there unrecorded liabilities sitting off the balance sheet, and does independent evidence actually back up every add-back on the schedule?
There are two versions of this report, and they serve opposite sides of the table. A buy-side QoE gets commissioned by the buyer after a letter of intent is signed, and its findings become the primary ammunition in any attempt to retrade the deal, so the seller spends that phase entirely on defense. A sell-side QoE flips the sequence: the seller commissions it before ever going to market, finds and fixes the problems before a buyer's team can find them first, and walks into negotiations holding a validated earnings figure rather than a hopeful one.
That sequencing changes the entire dynamic of the negotiation. Instead of the buyer investigating and the seller defending, the seller arrives having already verified the number, which shifts the burden of proof onto the buyer to disprove a validated figure rather than onto the seller to justify an unvalidated one. It's a subtle shift, but it separates negotiating from strength from negotiating from the back foot.
There's a speed dividend too. A sell-side QoE can shave several weeks off the closing timeline simply by eliminating the back-and-forth that normally follows a buyer's advisor discovering a surprise mid-diligence. And there's a pricing dividend on top of that: a business with audit-ready financials backed by an independent QoE tends to trade at a meaningfully higher multiple than a comparable business with messy, unvalidated books.
One more development makes this less optional than it used to be. As of October 1, 2026, SBA change-of-ownership loans on purchases of $3 million or more require a Quality of Earnings report on both initial acquisitions and expansions. It's deal-enabling infrastructure.
Cost scales with size, as expected. Set against that cost, practitioners consistently estimate returns of 4x to 10x on the initial investment, measured in final sale price improvement. In 2026, QoE costs run roughly $15,000–$25,000 for sub-$3M EBITDA businesses, $25,000–$50,000 for $3M–$10M EBITDA businesses, and $50,000–$75,000+ for $10M+ EBITDA businesses BizBuySell Q1 2026 Insight Report. Providers span the Big 4 (PwC, KPMG, Deloitte, EY), large specialty firms (BDO, Grant Thornton, Baker Tilly, RSM, CohnReznick), and boutique QoE firms (Aprio, Cherry Bekaert, Forvis Mazars, Eide Bailly, Marcum, Plante Moran, Citrin Cooperman).
Adjustments that expand the multiple, not just the earnings base
Everything covered so far deals with the earnings base itself, the number the multiple gets applied to. The multiple reflects how buyers assess risk and durability in the earnings stream rather than serving as a fixed constant tied purely to deal size. It reflects how buyers assess risk and durability in the earnings stream. Two businesses sitting at identical EBITDA can trade at meaningfully different multiples based purely on qualitative factors.
Recurring revenue is the clearest one. Contracted, predictable revenue lowers a buyer's perceived risk relative to the same EBITDA earned through one-off, transactional sales, and buyers, along with the lenders financing them, apply lower discount rates to cash flow they can actually count on. The valuation effect here is real and sits entirely apart from anything happening in the normalization process.
Owner independence is another. Sunbelt Atlanta's analysis notes that sophisticated buyers now treat owner dependency as a core risk factor in its own right, and businesses where daily operations depend on the founder's personal relationships or specific knowledge get penalized with lower multiples. A documented operations manual, a trained management layer, systems that keep functioning without the founder physically present, all of it reduces transition risk for the buyer, and reduced transition risk is exactly what gets rewarded with a better multiple. Key employee retention sits right alongside this as something buyers flag explicitly during diligence.
Customer concentration cuts the same direction. Heavy reliance on one or two customers raises the buyer's fear that losing one relationship would gut the very earnings they're paying a multiple against, so a diversified customer base with strong retention, or long-term contracts locking in the largest accounts, supports a stronger number.
Financial record quality matters here too, separate from its role in the add-back process itself. Sunbelt Atlanta's 2026 analysis found buyers treating clean financial records as a proxy for operational discipline more broadly, discounting businesses with inconsistent or opaque books against better-organized peers. Three years of tax returns that actually match the P&Ls, personal expenses cleanly separated out, a financial narrative that holds together year over year, all of it supports landing at the upper end of whatever multiple range the deal size allows.
Sector positioning is the last lever, and it's the one most outside an individual owner's control, though not entirely. Sunbelt Atlanta's analysis finds that technology-driven services, healthcare platforms, and supply chain automation or AI infrastructure are commanding the strongest multiples of 2026, while retail, traditional manufacturing, and low-margin distribution face compression even where the underlying fundamentals are solid. One might argue that a seller can't change what industry they're in. Fair enough. But a services business with recurring contracts and real digital infrastructure behind it can position itself, and get benchmarked, closer to a technology-services peer than a traditional operator, simply by how the story gets told and what gets emphasized in the data room.
How the current financing environment affects what buyers can pay
None of these adjustments happen in a vacuum. Buyers are financing these purchases with borrowed money, and the cost of that money shapes what they can afford to bid, regardless of how well-documented the seller's earnings are.
The prime rate has held at 6.75% as of May 2026, and SBA 7(a) loans, the financing vehicle behind a large share of small and lower middle market acquisitions, currently carry variable rates between 9.75% and 13.25%, with fixed-rate options running 11.75% to 14.75% depending on loan size and term. Rates in that range compress what a buyer can pay while still hitting the debt service coverage a lender requires. That is exactly why 61% of buyers in BizBuySell's Q1 2026 data said they want seller financing built into the deal structure. That's a substantial gap that reflects a direct response to the math: a seller note reduces the amount financed at double-digit bank rates, which improves the debt coverage ratio and, in turn, can support a higher total purchase price... It's a direct response to the math: a seller note reduces the amount financed at double-digit bank rates, which improves the debt coverage ratio and, in turn, can support a higher total purchase price than an all-cash-at-close structure would allow.
At the macro level, deal activity is not slowing to match the higher cost of capital. Global deal value climbed 41% year over year through the first five months of 2026, reaching $2.4 trillion, with valuations holding at a median 11.6 times EV/EBITDA according to Bain & Company's M&A Midyear Report. That figure sits well above the lower middle market ranges cited earlier, a reminder that headline multiples in large-cap M&A and the multiples available to a $2 million EBITDA business are describing two different markets entirely.
What does all this mean for an owner actually planning an exit in this environment? Financing cost is a variable outside any single seller's control, but everything else in this piece, the earnings normalization, the add-back discipline, the QoE, the multiple-expanding operational work, sits entirely within it. Rates set the ceiling on what a buyer can technically afford. A well-prepared seller gets anywhere close to that ceiling, while one whose earnings story never held up to scrutiny in the first place settles for a number well beneath it.